💻CONDITION MANAGER
Code Zero Visual Trading for TradingView
CONDITION MANAGER is a key module of the complex, which allows you to skillfully combine various external indicators to form trading signals or calculate constants. Thanks to its power, you can build most of your trading strategies using just CONDITION MANAGER" as if it's your Swiss Army knife in the world of trading.
Blocks of the module:
Association
This module implements your ideas, displays signals on the history, and organizes algo-trading.
General description of the indicator
CONDITION MANAGER is a real helper for traders who want to independently manage their trading strategies. It allows you to select the necessary data for analysis, such as stock prices, trading volumes, or indicators from other indicators. Based on these data, you can create rules (RULE) that will be the basis of the strategy.
Each rule can be configured using mathematical calculations, logical conditions, and special functions for data processing. This allows for precise market analysis and informed decision-making.
For more complex strategies, rules can be grouped (GROUP). There are four groups, each of which can contain a set of rules combined with logical "AND" or "OR" operators. Groups can also be interconnected by the same principles, creating complex combinations of conditions.
When all conditions are checked and they meet the set criteria, the indicator can send a signal to an external system. Such a signal can contain a text message, which is formed from standard TradingView variables and special variables created on values from rules and constants.
As for constants (CONSTANT), the indicator provides four special variables with numerical values that can be used to pass parameters into the strategy or as variables in alerts. These constants can have a constant value or a dynamic one that changes over time, making them useful for adapting the strategy to market changes, for example, when the price reaches the upper boundary of the Bollinger Bands.
As a result, this indicator allows traders to create individual trading strategies of any complexity, using a variety of data and conditions, and easily integrate them with external automated trading systems.
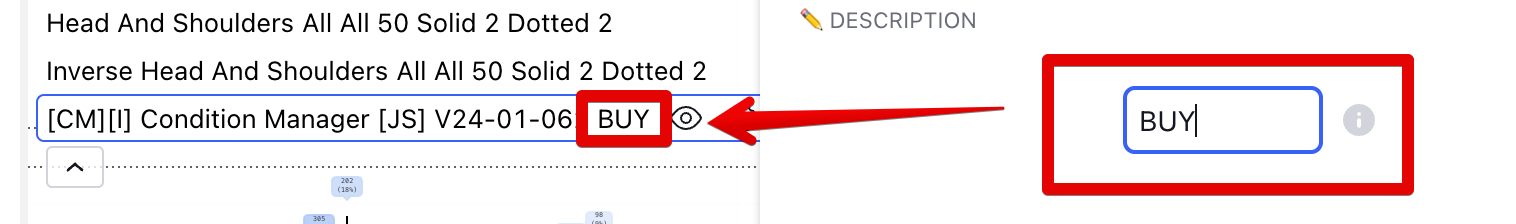
Hint In each indicator at the top, there is a DESCRIPTION field where you can write any text that will help to label this indicator on the TradingView chart.
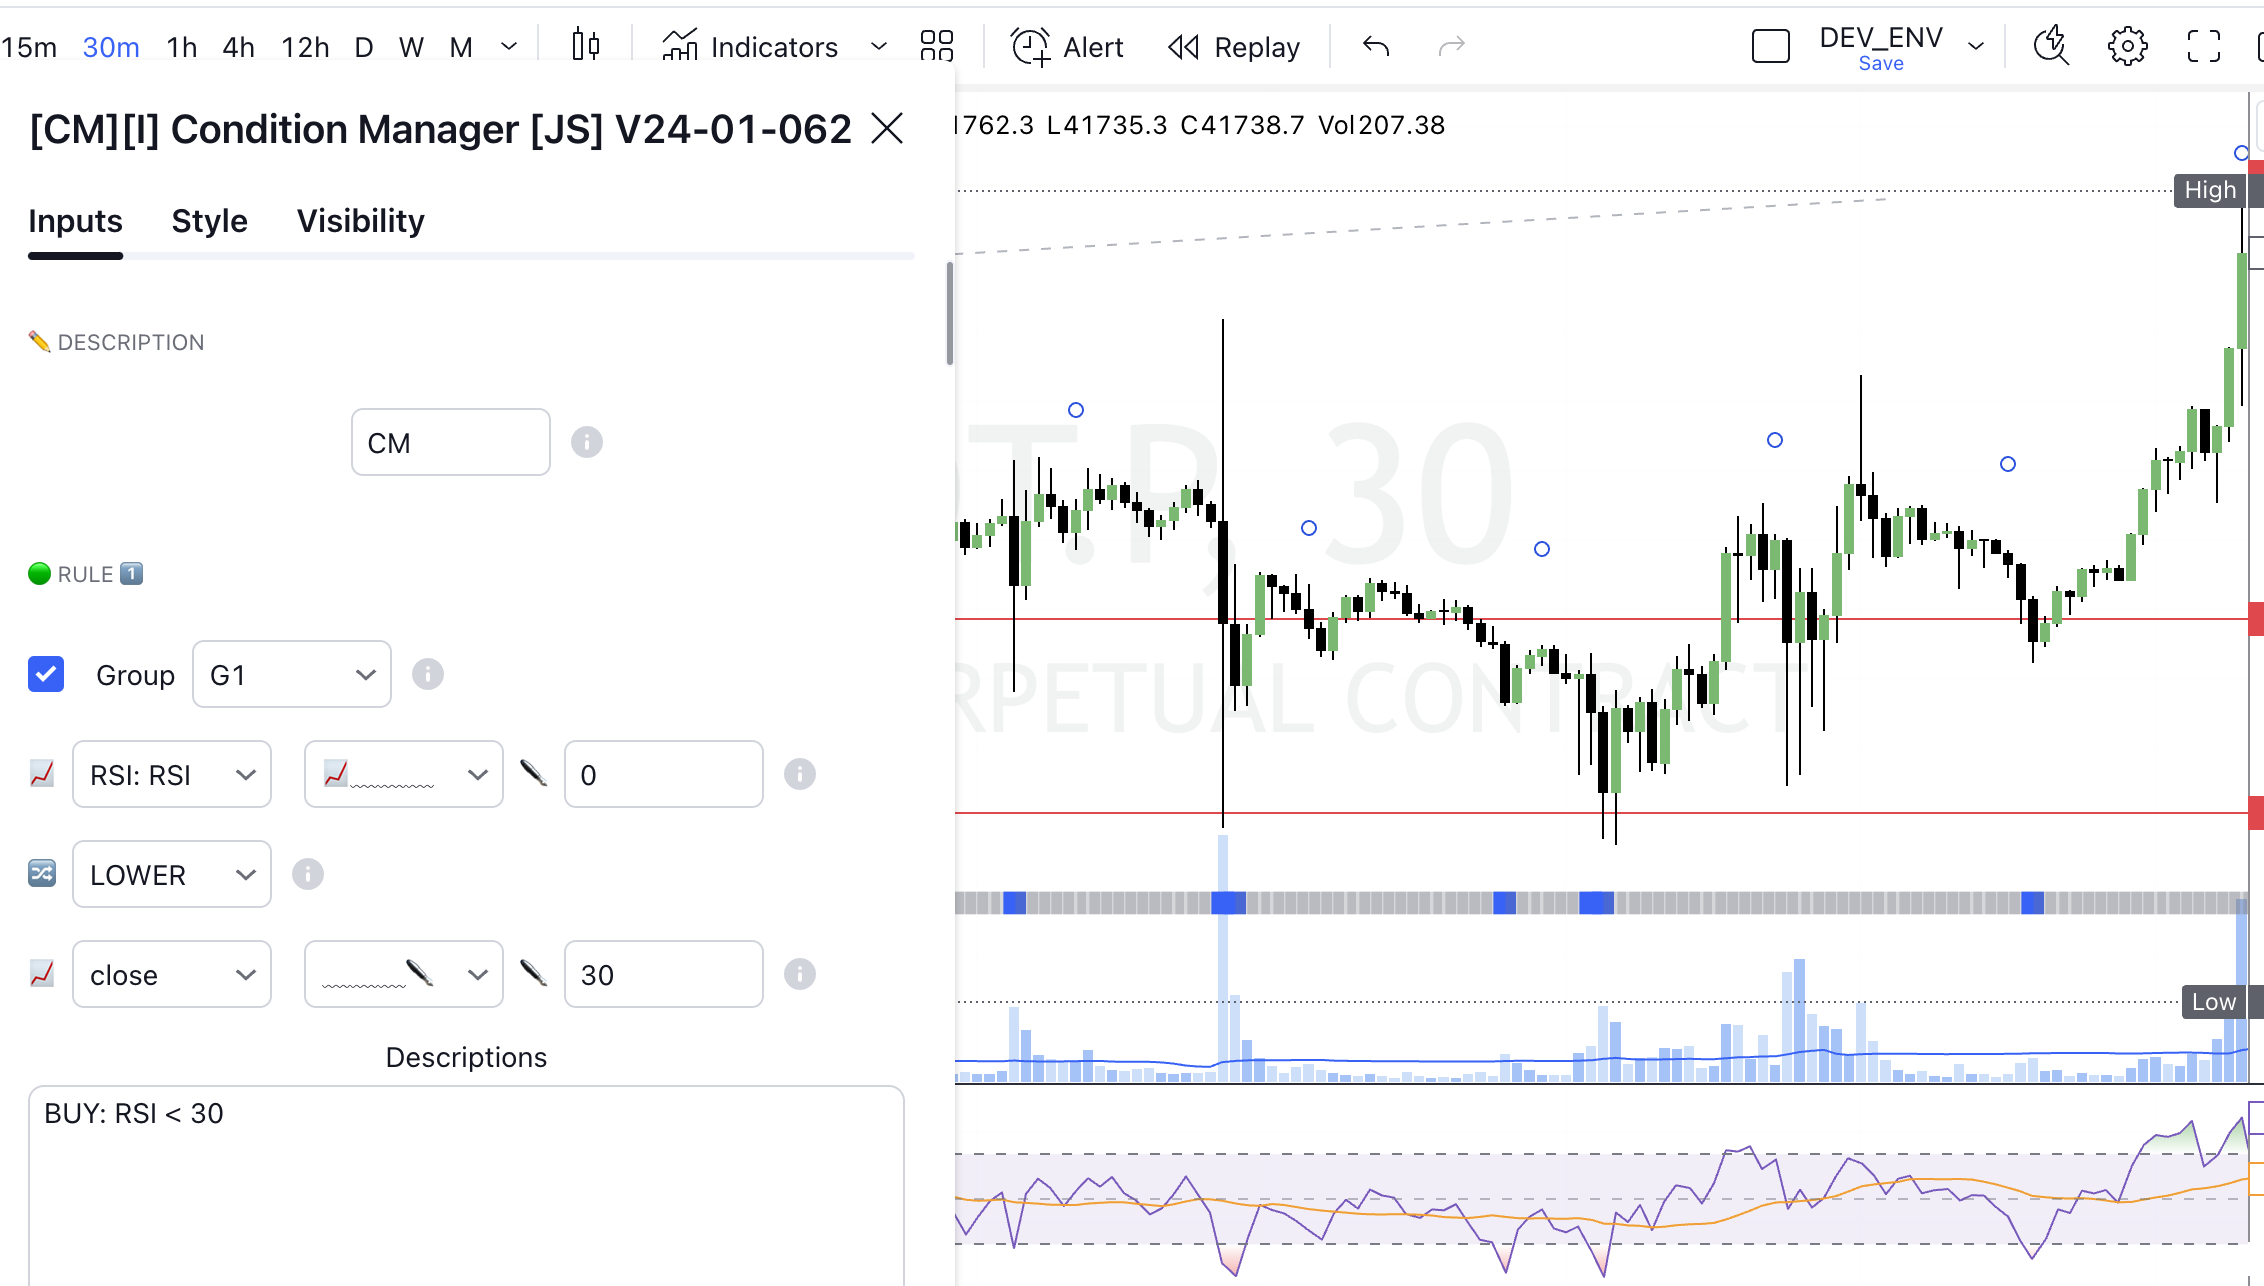
1. RULE
This block helps traders to choose different types of trading data, such as stock prices, sales volume, or indicators from other indicators. Based on these data, you can create special rules (RULE) that will manage your trading strategy.
In each such rule, you can apply mathematical calculations, use logical conditions, and combine data using aggregator functions for more precise analysis and decision-making in trading.
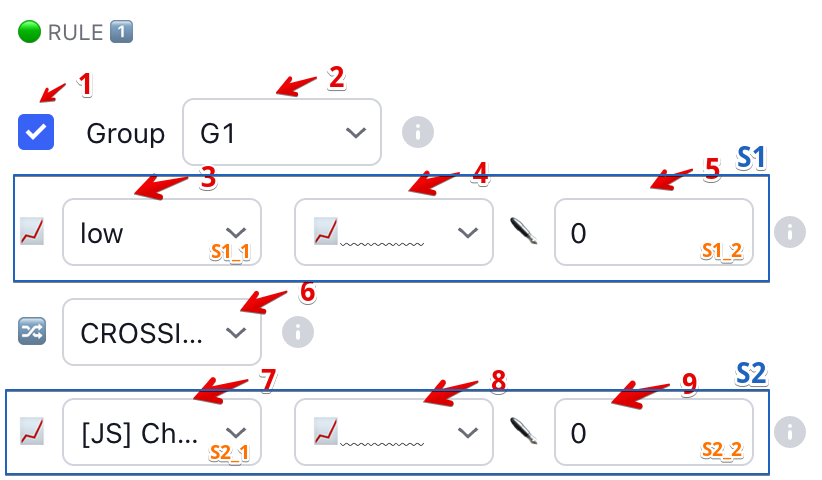
Field descriptions:
1
Switch
Turns this rule on and off.
2
Group selection
The group of rules to which this particular rule belongs.
3
Data source 1: S1_1
Where to get the data from to generate the condition.
4
Source pointer or aggregator function
Indicates which source we take to analyze without modification (S1_1 or S1_2), or which function we will perform to modify source S1_1.
5
Manual input or parameter for a function: S1_2
You can enter a value with which other sources in the rule will be compared, or set parameters for the selected function in step 4.
6
Condition
An operation to equalize two data sources.
7
Data source 2: S2_1
Where to get the data from to generate the condition.
8
Source pointer or aggregator function
Indicates which source we take to analyze without modification (S2_1 or S2_2), or which function we will perform to modify source S2_1.
9
Manual input or parameter for a function: S2_2
You can enter a value with which other sources in the rule will be compared, or set the parameters for the selected function in step 8.
Data source:
This is a field for selecting the data source that will be used in the rule. It can be any price or indicator.
If you turn on the switch next to the picture icon, you can draw a graph of the data source on the price chart (for example, draw the EMA line).

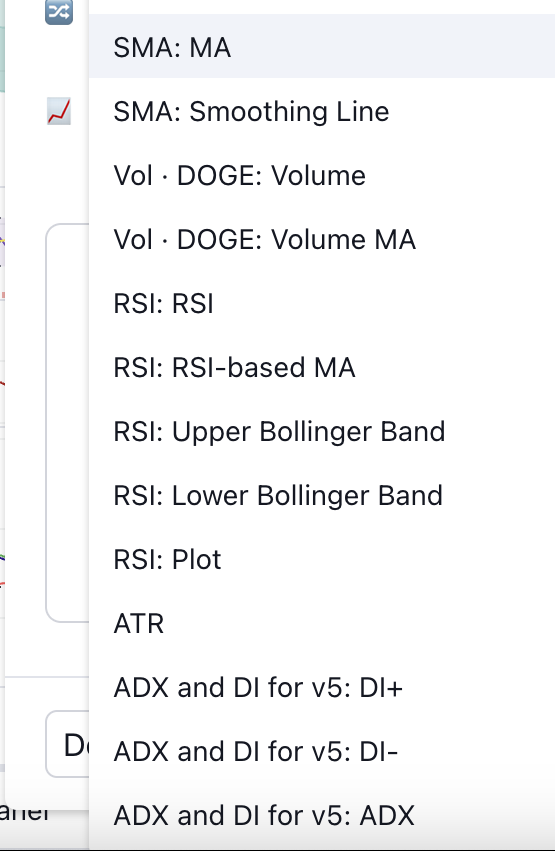
Source Pointer or Aggregator Function:
This field indicates which of the data fields needs to be used for the next step of the rule, or which aggregator function needs to be performed on S1_1 / S2_1 with parameters S1_2 / S2_2.
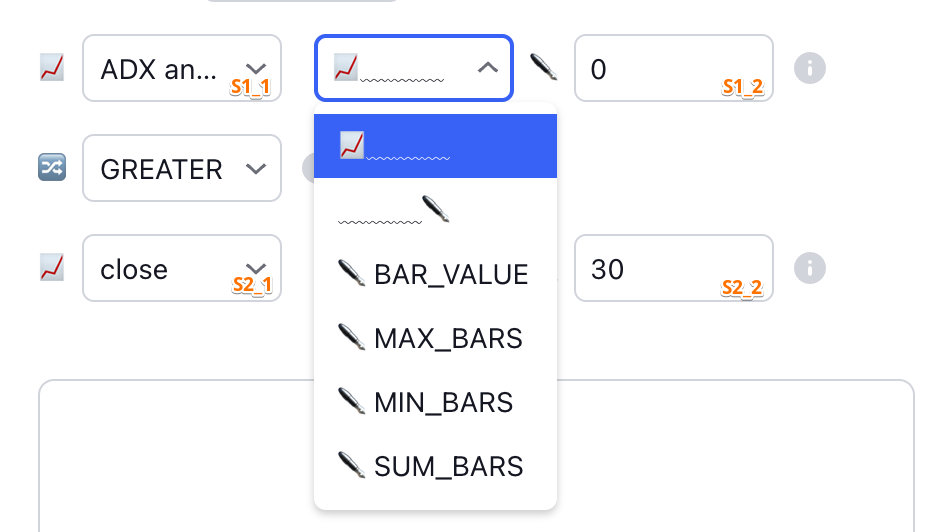
📈
Get the value of the selected source S1_1 or S2_1 without processing (from the left field)
✒️
Get the value entered by the user (from the right field)
✒️ BAR_VALUE
Get the previous value:
Select a source, such as S1_1 or S2_1, in the left field, and enter the number of bars back, in the right field.
If you select "close" and enter "1", you will get the closing price of one bar backwards
✒️ MAX_BARS
To get the maximum value in the past:
Select the source, for example, S1_1 or S2_1, in the left field, and specify the number of bars back in the right field.
To find the highest price for a certain period, select the source, for example, "high", and the number of past bars, say "5". Thus, you will see the highest price for the last 5 bars (excluding the current one).
✒️ MIN_BARS
To get the minimum value in the past:
Select the source, for example, S1_1 or S1_2, in the left field, and specify the number of bars back in the right field.
To find the lowest price for a certain period, select the source, for example, "low", and the number of past bars, say "20". Thus, you will see the lowest price for the last 20 bars (excluding the current one).
✒️ SUM_BARS
To get the sum of values in the past:
Select the source, for example, S1_1 or S2_1, in the left field, and specify the number of bars back in the right field.
To find the total volume for a certain period, select the source, for example, "volume", and the number of past bars, say "24". Thus, you will see the total volume for the last 24 bars (excluding the current one).
✒️ AVG_BARS
Get the average value in the past: Select a source, such as S1_1 or S2_1, in the left box and enter the number of bars back in the right box. To find the average over a certain period, select a source, such as "volume", and the number of bars that have passed, say "24". This will show you the total volume for the last 24 bars (excluding the current one).
✒️ SMA
Simple Moving Average (SMA) https://www.investopedia.com/terms/s/sma.asp
✒️ EMA
Exponential Moving Average (EMA) https://www.investopedia.com/terms/e/ema.asp
✒️ HMA
Hull Moving Average (HMA) https://www.technicalindicators.net/indicators-technical-analysis/143-hma-hull-moving-average
✒️ RMA
Relative Moving Average (RMA) https://www.tradingcode.net/tradingview/relative-moving-average/
✒️ SSMA
Smoothed moving average (SSMA) https://devexperts.com/dxcharts/kb/docs/smoothed-simple-moving-average
✒️ ATR
Average True Range (ATR) https://www.investopedia.com/terms/a/atr.asp
✒️ NATR
Normalized Average True Range (NATR) as a percentage. This is a normalized ATR, which means that it displays the ATR as a percentage rather than an absolute price. For example, a value of 1 indicates a true range of 1% for a given period. This indicator creates a moving average of the product's volatility over the period.
✒️ RSI
Relative Strength Index (RSI) https://www.investopedia.com/terms/r/rsi.asp
✒️ STOCH
Stochastic Oscillator (STOCH) https://www.investopedia.com/terms/s/stochasticoscillator.asp
✒️ PRICE_ANGLE
Calculation of % price change for the period in bars. It is calculated as a % deviation from the Low price at the beginning of the period and the High price at the end of the period.
✒️ Z-SCORE
Z-Score shows the relative deviation of a price from its mean.
✒️ HURST
HURST - Simple Hurst exponent.
Helps to detect trend/market reversal. Values from 0.5 to 1 - the market is in trend Values from 0 to 0.5 - the market is prone to mean reversion (flat).
⤴️ CONSTANT_1 ⤴️
...
⤴️ CONSTANT_6 ⤴️
Special placeholder variables that carry the value that was calculated in the corresponding CONSTANT block. They allow you to set conditions based on the calculated constants of the same module.
Thus, after performing these actions, we will get the initial value for checking the rule condition (the upper value - S1 and the lower value S2).
Condition:
This field sets the condition or action by which we will determine the fulfillment of the rule.
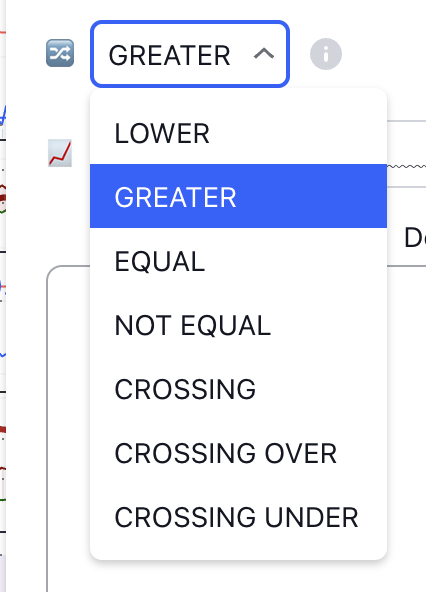
LOWER
S1 is less than S2
GREATER
S1 is larger than S2
EQUAL
S1 equals S2
NOT EQUAL
S1 is not equal to S2
CROSSING
S1 crossed S2
CROSSING OVER
S1 crosses S2 from above when its current value becomes above S2 after previously being below or equal to S2.
CROSSING UNDER
S1 crosses S2 from below when its current value becomes less than S2 after previously being above or equal to S2.
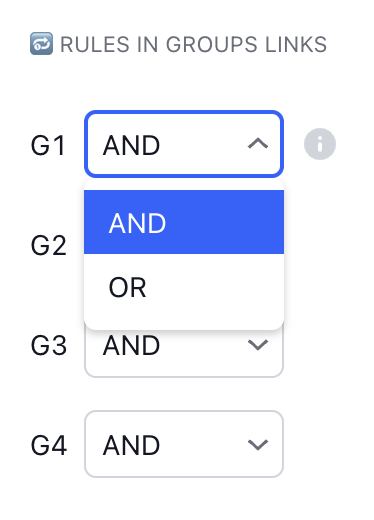
2. GROUP
A rule group (GROUP) is like a list of instructions for a program, telling it what to do in certain situations. These instructions can be as simple as "buy when the price is above the previous high," or as complex with many details. The user has the option to select four such rule groups: G1, G2, G3, G4.
Imagine you're preparing a meal and you have recipes (rules) for a salad and a soup. If you use "AND," you need to prepare both the salad and soup for the meal to be complete. But if you use "OR," preparing just one of them is sufficient.
The same applies in trading: if you want the conditions to work together ("AND"), all of them must occur to execute the action. If you set "OR," then it is sufficient for at least one condition to occur for the system to act.
This gives traders the ability to create strategies with various "scenarios," experimenting with different sets of rules to see which ones work best.
The program has a special place where you can configure how the rules in the group will interact with each other:
3. Logical Union of GROUPS
Rule groups (G1, G2, G3, G4) can be combined with each other using the same logic as the rules within a group (AND or OR).
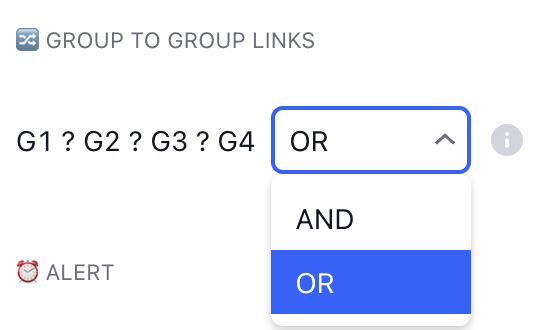
Imagine the rule groups as separate teams in a large football league. Each team has its own strategy and tactics, but when it comes to the championship, they unite using "AND" or "OR" to achieve a common goal - victory in the market.
If you use the "AND" operator to combine groups, it means that the conditions of all groups must be met simultaneously to activate the signal. It's as if all teams must win their matches for the trade to be executed. A high strategic game where everything must come together perfectly!
But if you combine groups through "OR," fulfilling the conditions of at least one group of rules is enough to activate the signal. That is, if even one team wins, you get the green light for the trade. This adds flexibility, as it allows for quicker responses to changing market conditions.
This approach allows for more flexible and adaptive strategies that can respond to various market behavior scenarios, using combinations of different rule groups. It's like having not one, but several coaches, each offering their game plan, and you choose the best option for attacking or defending your investments.
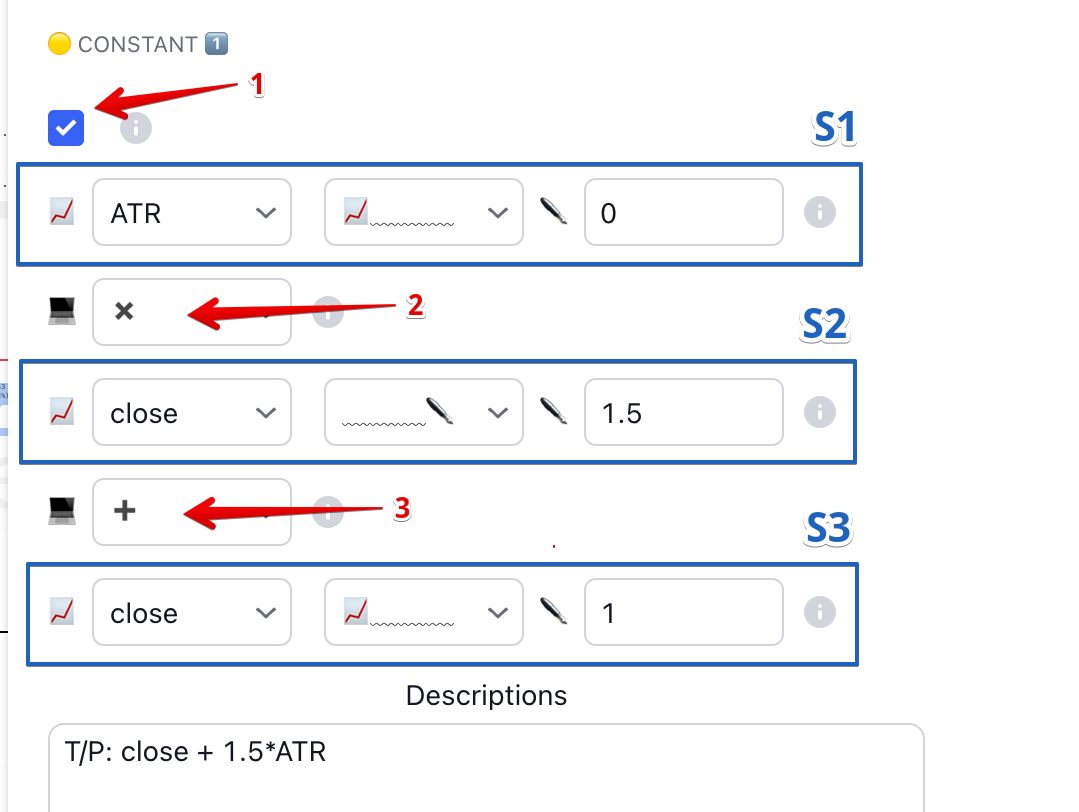
4. Constants
IMPORTANT
In the constants block, all calculations are performed sequentially, one after the other, starting from the top and moving downwards. Regardless of whether it's multiplication or division - there are no "priority" operations, everything goes in order, like in a shopping list: first, we buy bread, then milk, and only after that - chocolate.
Clarification:
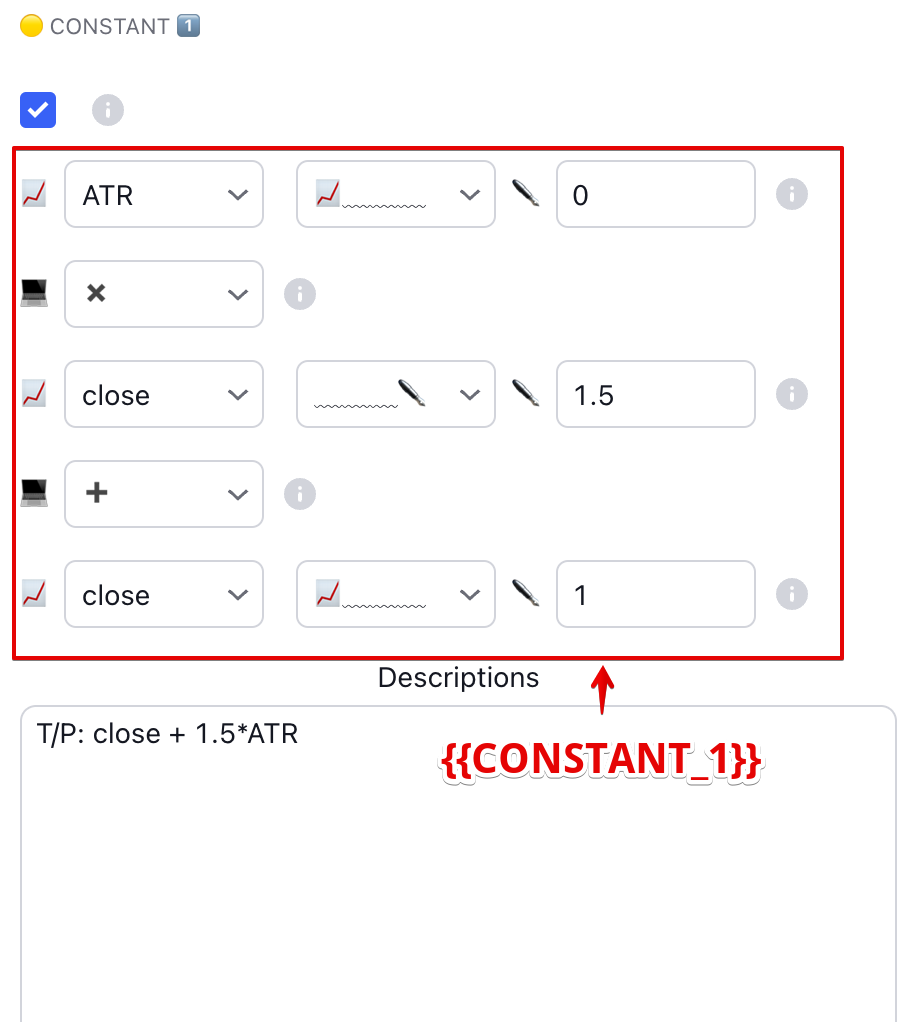
TakeProfit:
close + 1.5 * ATR
you need to calculate in this way:
ATR * 1.5 + close
First, the multiplication is carried out and the closing price is added to the result.
Clarification:
StopLoss:
low - 1.5 * ATR
you need to calculate in this way:
ATR * (-1.5) + low
First, multiplication is performed to obtain a negative value, and then the minimum price is added to the result.
A constant is like a calculator that allows you to combine various data, such as prices and indicator values, and perform simple mathematical operations with them, such as addition or multiplication. You can use a constant to automatically calculate important trading parameters, such as the price for taking profit (TakeProfit) or setting a stop loss (StopLoss).
The constant (as shown below) has 3 blocks of data sources (or user input values) that have the same logic as in the rule block (RULE) and can also be turned on and off (block 1). Between these blocks, you can perform mathematical operations: addition (✚), subtraction (➖), modulo subtraction ([➖]), multiplication (✖️), and division (➗) (blocks 2, 3). An additional 'NONE' mode indicates that the next data source should not be included in the calculation chain. Continuing our culinary analogy, it's like deciding not to add salt to a dish - we simply ignore this ingredient.
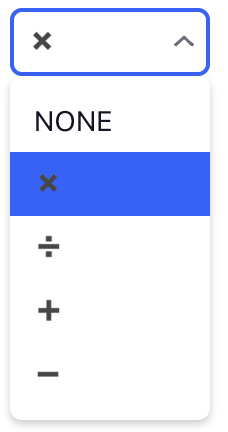
Imagine that you want to set the TakeProfit price based on the current closing price plus one and a half times the value of ATR (Average True Range). To do this, you simply need to take the last closing price (S3), add to it the result of multiplying the ATR (S1) by 1.5 (S2), and you get your TakeProfit price: close (S3) ✚ ATR (S1) ✖️1.5 (S2).
5. Alerts
Alerts are a built-in feature of TradingView that we enhance with additional functionality.
TradingView alerts are instant notifications you receive when the market situation matches the conditions you have set. For example, "Apple's stock price has risen above $150". All users can receive pop-up notifications, sound signals, email-to-SMS, and push notifications sent to their phone. Users with TradingView Essential, Plus, and Premium subscriptions can also receive Webbhook notifications when alerts are triggered.
In the ALERT block, you need to set the text of the alert template to be sent and the frequency of its sending.
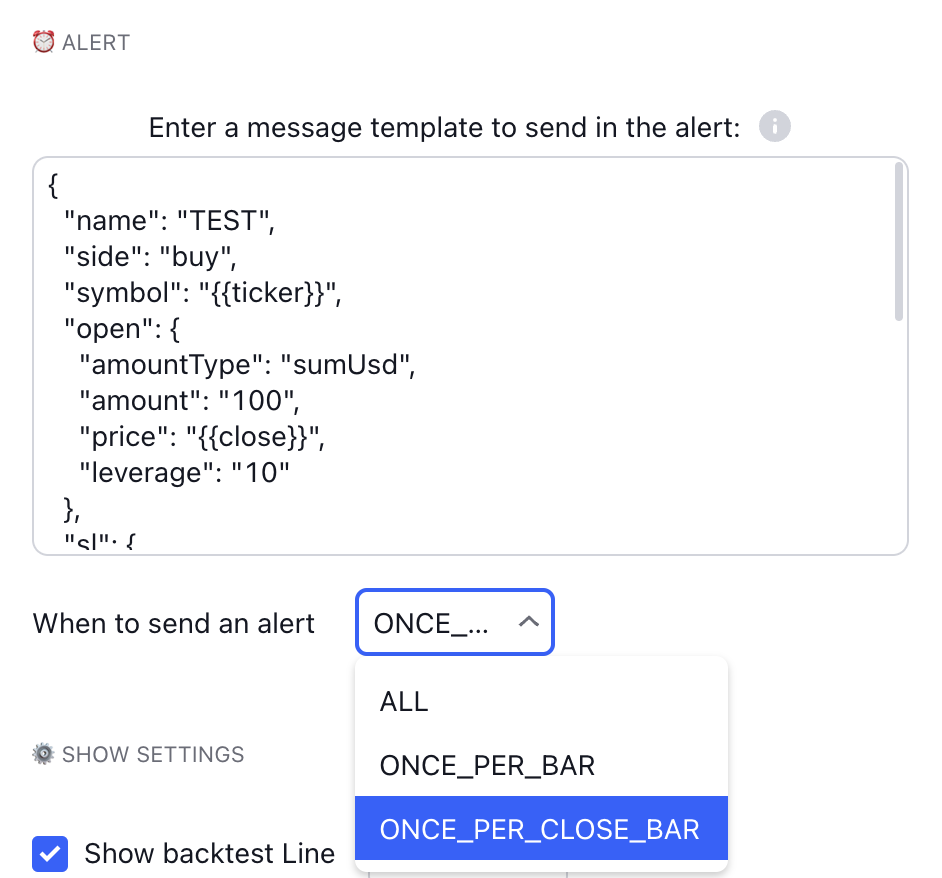
ALL
Send notifications every time they are activated, but be careful. If this happens too often, TradingView may disable your notifications.
ONCE_PER_BAR
Send the notification only once for each bar when the condition is first met. If the notification has already been sent, a new one will appear only on the next bar.
ONCE_PER_CLOSE_BAR
Send alerts only at the close of the bar, regardless of the number of times conditions are met during that bar.
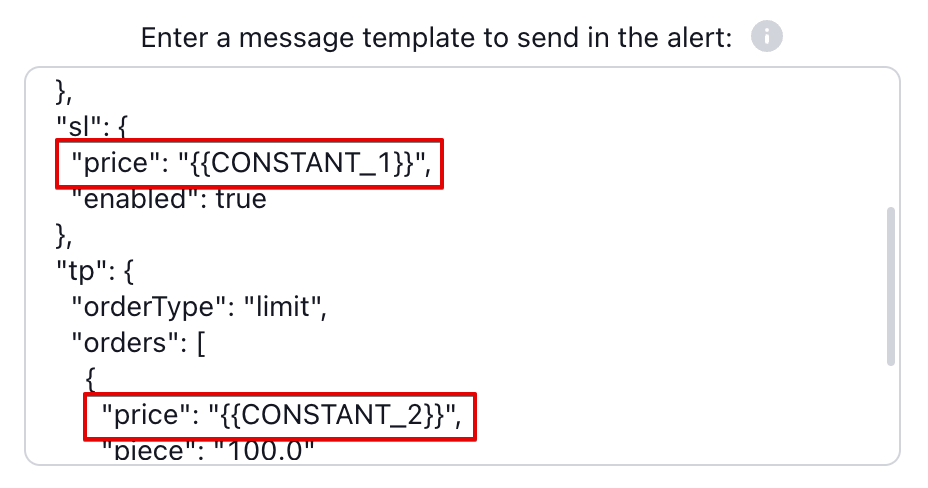
You can supplement the standard variables for messages on TradingView with your own, which you create in the "Rules" (RULE) and "Constants" (CONSTANT) blocks.
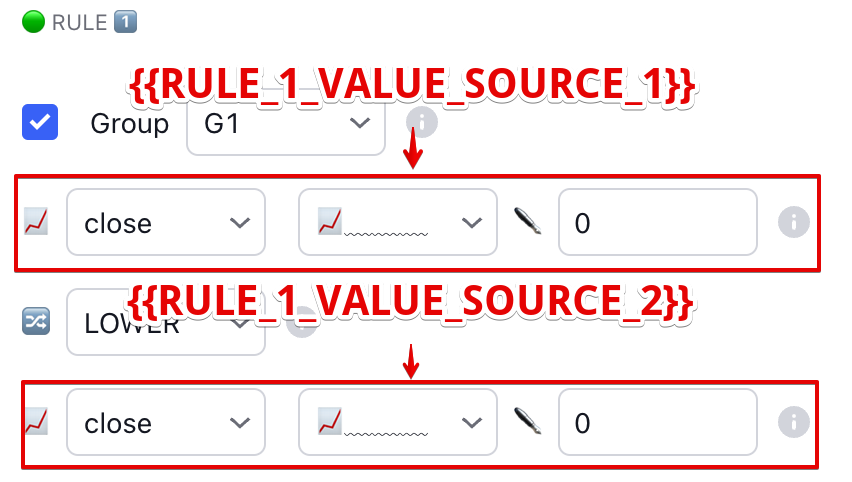
{{RULE_1_VALUE_SOURCE_1}} ... {{RULE_8_VALUE_SOURCE_1}}
Value from the data source in the condition (RULE) above
{{RULE_1_VALUE_SOURCE_2}} ... {{RULE_8_VALUE_SOURCE_2}}
Value from the data source in the condition (RULE) below
{{CONSTANT_1}} ... {{CONSTANT_4}}
Constant value
Setting up an alert
You can read about how to set up alert sending on the TradingView website:
How to connect sending to various trading systems:
3Commas: https://3commas.io/trading-view
aleeert: https://aleeert.com/docs/
Hint
Please note that alerts can also be sent from the CONDITION MANAGER STRATEGY module.
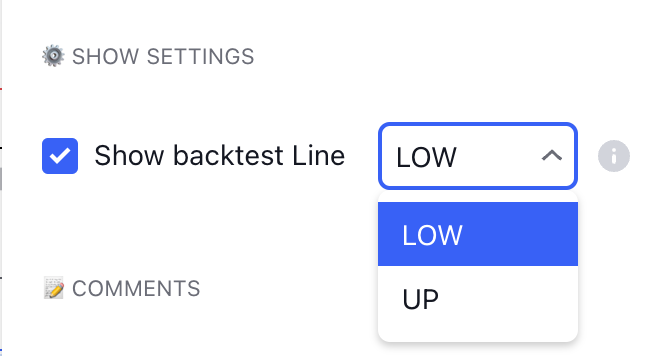
6. Backtesting Line
The visual back-testing system CONDITION MANAGER allows you to test strategies on historical data. This is an additional testing system that complements, rather than replaces, the historical data strategy back-testing system of the TradingView platform.
On the chart, this appears as a line of gray squares on each bar, and when your strategy indicates that a condition is met, the squares turn blue. This helps you understand when the strategy is working and to quickly make changes if needed.
These blue squares are your benchmarks on the path to a profitable strategy. They help you identify the points in time when your approach was effective and, conversely, when it's necessary to stop and rethink your tactics.
For convenience, this back-testing line can be displayed at the top, bottom, or turned off.
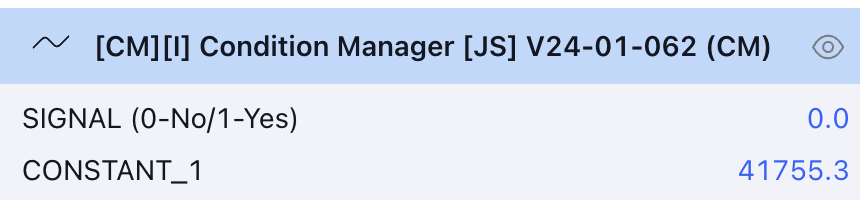
7. Output data
The indicator on the output has many values. The first output is information about whether the conditions are met, and the other outputs are values of constants and condition sources (the outputs are activated depending on whether the constant is enabled: CONSTANT_1, CONSTANT_2, CONSTANT_3, CONSTANT_4, CONSTANT_5, CONSTANT_6.
Last updated